analysis
Curiosity-Led Execution (5-minute read)
Most organizations don’t struggle because they lack solutions—they struggle because they misdiagnose problems. A structured, curiosity-led approach accelerates alignment, reduces rework, and leads to solutions that actually stick.
My Starting Point
I was not a fan of consultants when I first started working with them. Most were arrogant, had limited focus, and viewed problems or goals in isolation. I later learned that the same could be said for salespeople, executives, and more. It had less to do with the role but was more evident when people presented themselves as experts.
Switching to consulting was a tough sell. When I finally accepted a position, I expected to learn proven methodologies from seasoned experts. The lessons learned were not always what I had anticipated.
Many of the senior consultants I worked with had been highly successful early in their careers. But over time, that success calcified into rigid frameworks and default approaches. They weren’t completely wrong—but they weren’t adaptable or as effective as they could have been, either.
It reminded me of the old metaphor: “If the only tool you have is a hammer, everything looks like a nail.”
At one point, I seriously questioned whether consulting was the right fit for me.
Then I stepped back and looked at the best consultants I had worked with—the ones clients trusted and consistently delivered outcomes. I asked a simple question:
What do they do differently?
The answer wasn’t just expertise. It was curiosity, combined with the desire to deliver a positive experience that delivers tangible positive outcomes.
From Depth to Insight
Early in my career, I went deep—sometimes excessively so.
I read dozens of manuals for a relational database system, cover to cover, just to understand how it worked. Then I spent years, while traveling, going through its source code, trying to understand why it worked the way it did.
That effort paid off. I became recognized as an expert for that product, which opened the door to many challenging and exciting consulting engagements.
But it also revealed a limitation: Depth alone doesn’t scale.
What scaled was the mindset that I developed with it:
- Looking beyond surface-level symptoms.
- Viewing problems from a systemic perspective. Understanding how systems interact (not just how they function).
- Asking how and why decisions were made, not just what decisions were made.
I learned to read between the lines—technically and organizationally. To understand not just systems, but the people and processes behind them.
That context is powerful, but difficult to extract—especially quickly.
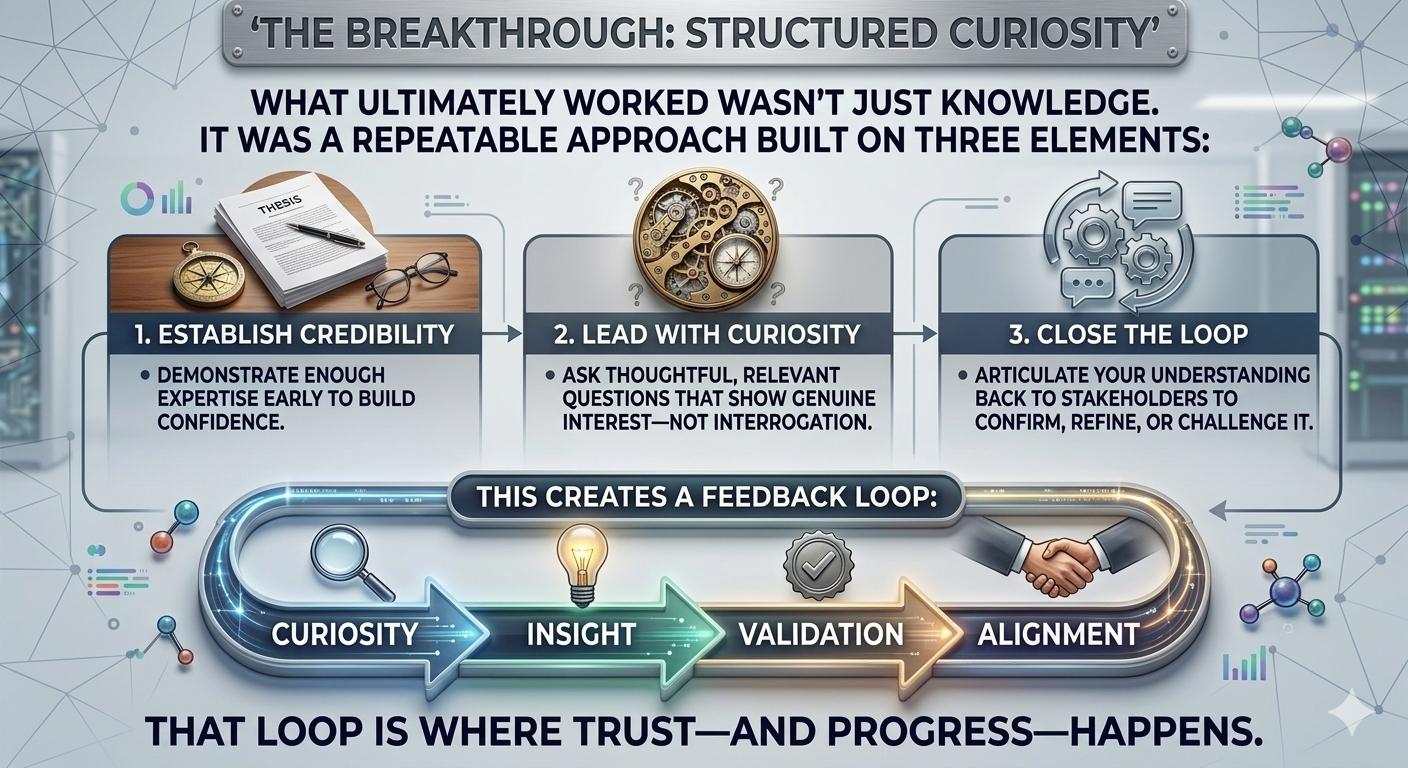
The Breakthrough: Structured Curiosity
What ultimately worked wasn’t just knowledge. It was a repeatable approach built on three elements:
- Establish credibility
Demonstrate enough expertise early to build confidence. - Lead with curiosity
Ask thoughtful, relevant questions that show genuine interest—not interrogation. - Close the loop
Articulate your understanding back to stakeholders to confirm, refine, or challenge it.
This creates a feedback loop:
Curiosity → Insight → Validation → Alignment
That loop is where trust—and progress—happens.
A Practical Tactic: The “Columbo Technique”
One of the most effective tools I’ve used is commonly called the Columbo Technique.
The idea is simple: Lower defenses by creating psychological safety—and a sense of control.
Instead of pushing for answers, you:
- Ask informed questions
- Make partial observations
- Then, intentionally leave a gap
Something like:
“I might be missing something, but I’m not fully connecting how X impacts Y…”
This does two things:
- Signals humility (reducing resistance)
- Invites correction (which reveals deeper truth)
People tend to open up—not because they’re forced to, but because they want to contribute. They feel safe because you are focused on understanding the situation and solving the problem, and not pointing fingers or assigning blame.
And once that happens, you get access to what actually matters: the “why” behind the “what.”
Applying This in the Real World
This approach works across consulting, sales, and leadership—but only if applied deliberately.
Here’s how to operationalize it:
1. Start Broad Before Going Deep
Don’t jump to solutions. Map the landscape first:
- Stakeholders
- Systems
- Constraints
- History
2. Use Their Language
Mirror terminology and examples. It builds alignment faster than forcing your own framework.
3. Validate Early and Often
Don’t wait until the end to present conclusions. Share evolving understanding:
- “Here’s what I think I’m seeing…”
- “Does this match your experience?”
- “Can you help me identify reasons why this might not work?”
4. Balance Confidence with Curiosity
Too much confidence shuts people down.
Too much curiosity erodes credibility.
The balance is where influence lives.
5. Optimize for Adoption, Not Perfection
The best solution is the one that gets implemented and sustained—not the one that looks best on paper.
A great example of this is at a large insurance company, where I led a successful 18-month redesign and implementation of a common Risk Management System used across three distinct businesses.
Before I came, they spent two years and several million dollars with a Big 5 Consulting company. The output was several 3” binders filled with specifications, definitions, and design documents. It was amazing, but wasn’t implementable. I have seen that far too often on consulting engagements.
A section in the middle of this post describes what happened with that project.
Make It Repeatable with the CLEAR Framework
This is a simple, reusable model that can help anyone new to a company or role.
The C.L.E.A.R. Framework
C — Credibility
- Establish baseline trust quickly.
- Demonstrate you “speak their language.”
L — Learn
- Map systems, stakeholders, constraints, and history.
- Ask high-quality, layered questions.
E — Expose
- Surface gaps, contradictions, hidden dependencies.
- Use techniques like the “Columbo Method.”
A — Align
- Play back understanding.
- Build shared clarity before prescribing.
R — Recommend
- Deliver solutions optimized for adoption and results, not elegance alone.
Why This Matters
When you lead with curiosity, you move faster—not slower.
You avoid rework.
You uncover hidden constraints early.
You gain stakeholder alignment before decisions are locked in.
And occasionally, you can help solve problems that have existed for years—in a matter of weeks—because you’re solving the right problem.
If this sounds interesting and you would like to discuss it further or seek out assistance, contact me here.
To Measure is to Know
Lord William Thomson Kelvin was a pretty smart guy who lived in the 1800s. He didn’t get everything right (e.g., he supposedly stated, “X-rays will prove to be a hoax.”), but his success ratio was far better than most, so he possessed useful insight. I’m a fan of his quote, “If you can not measure it, you can not improve it.”
Business Intelligence (BI) systems can be very powerful, but only when embraced as a catalyst for change. What you often find in practice is that the systems are not actively used or do not track the “right” metrics (i.e., those that highlight something important – ideally something leading – that you have the ability to adjust and impact the results), or provide the right information – only too late to make a difference.

The goal of any business is to develop a profitable business model and execute extremely well. So, you need to have something people want, deliver high-quality goods and/or services, and finally make sure you can do that profitably (it’s amazing how many businesses fail to understand this last part). Developing a systematic approach that allows for repeatable success is extremely important. Pricing at a competitive level with a healthy profit margin provides the means for sustainable growth.
Every business is systemic in nature. Outputs from one area (such as a steady flow of qualified leads from Marketing) become inputs to another (Sales). Closed deals feed project teams, development teams, support teams, etc. Great jobs by those teams will generate referrals, expansion, and other growth – and the cycle continues. This is an important concept because problems or deficiencies in one area can negatively affect others.
Next, the understanding of cause and effect is important. For example, if your website is not getting traffic, is it because of poor search engine optimization or bad messaging and/or presentation? If people visit your website but don’t stay long, do you know what they are doing? Some formatting is better for printing than reading on a screen (such as multi-column pages), so people tend to print and go. And external links that do not open in a new window can hurt the “stickiness” of a website. Cause and effect are not always as simple as they seem, but having data on as many areas as possible will help you identify which ones are important.
When I had my company, we gathered metrics on everything. We even had “efficiency factors” for every Consultant. That helped with estimating, pricing, and scheduling. We would break work down into repeatable components for estimating purposes. Over time we found that our estimates ranged between 4% under and 5% over the actual time required for nearly every work package within a project. This allowed us to profitably fix bid projects, which in turn created confidence for new customers. Our pricing was lean (we usually came in about the middle of the pack from a price perspective, but a critical difference was that we could guarantee delivery at that price). More importantly, it allowed us to maintain a healthy profit margin to hire the best people, treat them well, invest in our business, and create sustainable profitability.
There are many standard metrics for all aspects of a business. Getting started can be as simple as creating sample data based on estimates, “working the model” with that data, and seeing if this provides additional insight into business processes. Then ask, “When and where could I have made a change to positively impact the results?” Keep working until you have something that seems to work, then gather real data and validate (or fix) the model. You don’t need fancy dashboards (yet). When getting started, it is best to focus on the data, not the flash.
Within a few days, it is often possible to identify and validate the Key Performance Indicators (KPIs) that are most relevant to your business. Then, start consistently gathering data, systematically analyzing it, and then work on presenting it in a way that is easy to understand and drill-into in a timely manner. To measure the right things really is to know.
Spurious Correlations – What they are and Why they Matter

In an earlier post, I mentioned that one of the big benefits of geospatial technology is its ability to show connections between complex and often disparate data sets. As you work with Big Data, you tend to see the value of these multi-layered and often multi-dimensional perspectives of a trend or event. While that can lead to incredible results, it can also lead to spurious data correlations.
First, let me state that I am not a Data Scientist or Statistician, and there are definitely people far more expert on this topic than myself. But, if you are like the majority of companies out there experimenting with geospatial and big data, it is likely that your company doesn’t have these experts on staff. So, a little awareness, understanding, and caution can go a long way in this scenario.
Before we dig into that more, let’s think about what your goal is:
- Do you want to be able to identify and understand a particular trend – reinforcing actions and/or behavior? –OR–
- Do you want to understand what triggers a specific event – initiating a specific behavior?
Both are important, but they are both different. My focus has been identifying trends so that you can leverage or exploit them for commercial gain. While that may sound a bit ominous, it is really what business is all about.
A popular saying goes, “Correlation does not imply causation.” A common example is that you may see many fire trucks for a large fire. There is a correlation, but it does not imply that fire trucks cause fires. Now, extending this analogy, let’s assume that the probability of a fire starting in a multi-tenant building in a major city is relatively high. Since it is a big city, it is likely that most of those apartments or condos have WiFi hotspots. A spurious correlation would be to imply that WiFi hotspots cause fires.
As you can see, there is definitely the potential to misunderstand the results of correlated data. A more logical analysis would lead you to see the relationships between the type of building (multi-tenant residential housing) and technology (WiFi) or income (middle-class or higher). Taking the next step to understand the findings, rather than accepting them at face value, is very important.
Once you have what looks to be an interesting correlation, there are many fun and interesting things you can do to validate, refine, or refute your hypothesis. It is likely that even without high-caliber data experts and specialists, you will be able to identify correlations and trends that can provide you and your company with a competitive advantage. Don’t let the potential complexity become an excuse for not getting started. As you can see, gaining insight and creating value with a little effort and simple analysis is possible.
